The use of multi-sensor fast-response probes is now relatively common place. Unfortunately, the size of these probes is often larger than is ideal. It is for this reason that single sensor probes are sometimes used in investigations of unsteady flow. In use, the single sensor probe must be placed at a number of different orientations to the flow, often by simply rotating the stem of the probe mount. The run time of a given experiment increases in proportion to the number of orientations employed. Furthermore, the number of orientations is usually more than is strictly required due to poor conditioning of the experiment so that a significant amount of redundant information is available and run-time costs are increased. This text describes a data reduction technique that reduces the run time cost of using single sensor fast response probes to the minimum. This is achieved by using all of the data obtained in the experiment so that there is no redundancy no matter how many orientations are employed. The method of least squares relies upon on comparing measured data with calibration data in order to obtain a best fit between the two datasets.
In the place of an X-wire probe or 3-sensor probe, a single sensor hot wire probe may be used in a two-dimensional and three-dimensional flow respectively.
In two-dimensional flows, to determine the magnitude of the mean velocity vector C, the yaw angle q and pitch angle f, it is best to minimise the quantity. In turbomachines, the hot wire anemometer is usually used to measure unsteady periodic flows. In this case, the phase-lock averaging technique is used to derive the ensemble-mean velocity <C> and flow angle <q >. The basis of the least-squares technique is to minimise the quantity
![]()
where, for example, <Ei> represents the phase-lock-average velocity indicated by the hot wire anemometer at the ith sensor position. In effect, this can be viewed as matching a rather crude calibration of the anemometer derived from the experiment to the actual calibration of the sensor. This matching takes place at each phase angle. In practice, the angular calibration is assumed to be independent of the magnitude of the velocity so that the above equation reduces to
![]()
When the flow is particularly unsteady, it has been found that it is better to employ a large number of positions and acquire a few ensembles at each position rather than the converse.
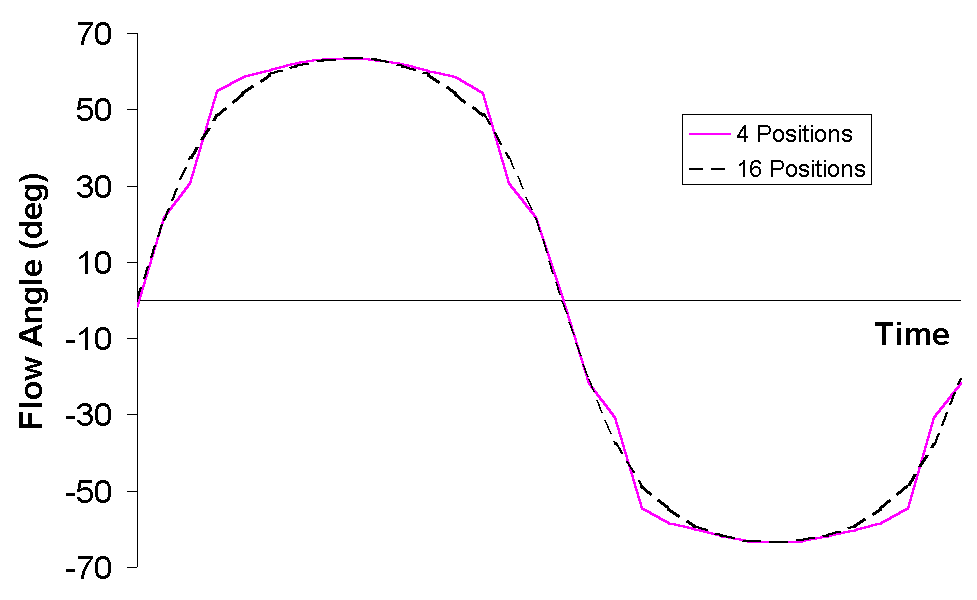
Figure 1 Ensemble-mean flow angle variation
derived from "Least-Squares" method
for total cost of 512 ensembles at each time level
Figure 1 shows the variation in flow angle as determined in two separate experiments. The total cost of each experiment was 512 ensembles. This is defined as the number of orientations of the probe multiplied by the number of ensembles acquired at each orientation. Fig. 8 shows the results obtained when using 4 and 16 positions of the sensor. The data obtained with 16 positions is much closer to the true answer. In the absence of large turbulent fluctuations, the error is negligible, irrespective of the number of positions employed.
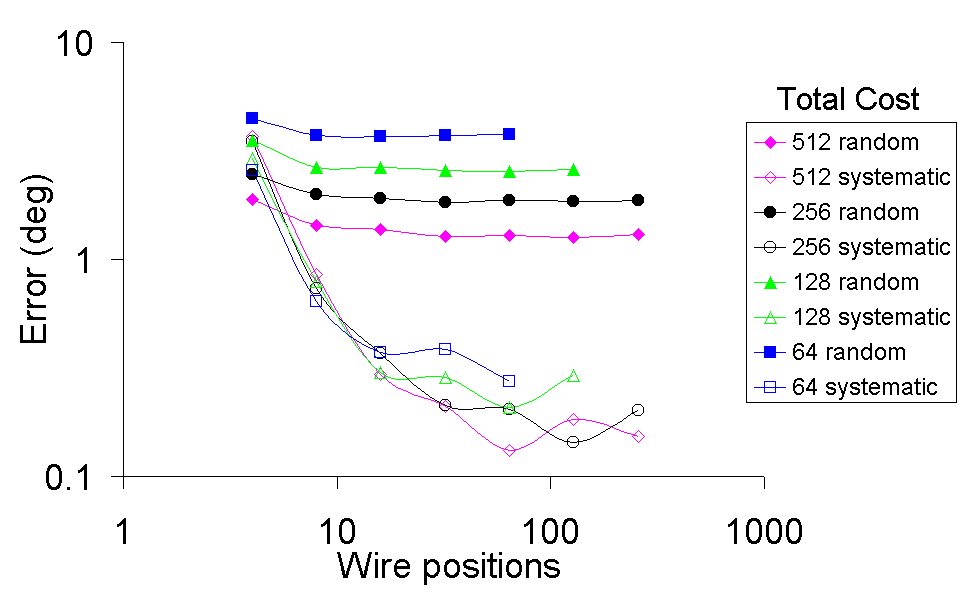
Figure 2 Effect of total cost and number of sensor positions
on the random and systematic errors in the measurement of flow angle
Figure 2 may be used to assess the effect of the number of sensor positions and the total cost (64 to 512 ensembles) on the accuracy of the measured flow angle. Because the random error will depend on the magnitude of the turbulence and the number of ensembles acquired, its absolute magnitude should not be compared to that of the systematic errors. Figure 2 indicates that in order to minimise the systematic error in the measurement of flow angle, at least 16 sensor positions should be employed. This is irrespective of the total cost. This is a far greater number of positions than the previous publications on this technique have suggested. In practical terms, the accuracy is independent of the number of sensor positions above 16. Above this limit, the accuracy only depends on the total cost. In less turbulent and/or unsteady flows, the systematic errors are reduced but fewer positions should not be used. The random error is effectively independent of the number of sensor positions. However, its magnitude does depend on the turbulence level within the flow.
The method is easily extended to three-dimensional flows.
In the case of a pressure probe, the flow angle, the stagnation pressure and the dynamic pressure may be determined. Therefore, a minimum of three positions is required to determine the flow conditions. Figure 3 shows a photograph of the pressure probe employed in the present investigation. The probe consists of a Kulite LQ062 transducer embedded within the face of a 60° triangular prism. This particular geometry was chosen because the 60° wedge probe is known to have a large capture angle. The transducer was placed sufficiently far from the probe tip that the effects of pitch upon the calibration are not large.

Figure 3 Fast response single-sensor pressure probe
The probe was calibrated in a suction tunnel downstream of the inlet bellmouth. Figure 4 presents the calibration of the pressure probe assessed here. The response is plotted in the form of the coefficient

where psensor, P0 and ps are the pressure measured by the probe, the stagnation pressure and the static pressure respectively. When the sensor faces the flow, the inlet stagnation pressure is measured. As the probe is rotated about its stem, the pressure falls to a minimum at about ±83°. Outside this range, the sensor indicates a relatively constant base pressure.
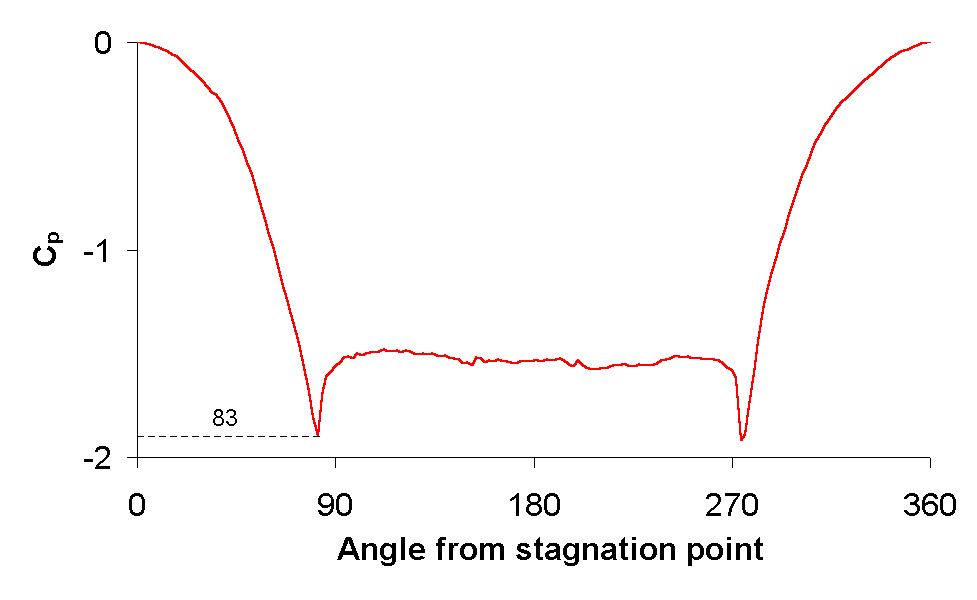
Figure 4 Angular calibration for pressure probe
In the case of the pressure probe, the quantity
![]()
was minimised since there are three unknowns. A comparison with the similar expression for the hot wire anemometer shows that the additional quantity to be determined is represented by the fact that the stagnation pressure will be different to that in the calibration. In this application, the asymmetry noted above and the relatively small capture angle are of little consequence. Providing the probe has an angular sensitivity over the range of angles selected, then each measurement will make a useful contribution to the evaluation of the minimum value of <c2>. Therefore, the capture angle is approximately ±83° and the concept of unambiguosity is irrelevant. Indeed, providing the calibration curves for forward and reversed flow curve are dissimilar, it is possible to unambiguously determine if there is reversed flow if sufficient probe angles are used over a large enough range. In this context it may be noted that using the implicit method described above provides a larger capture angle than using the conventional explicit method. It also suggests that the potential benefits of the Least Squares Method are far greater when applied to a pressure probe data than when applied to hot wire data.
Figure 5 presents results similar to those above for the hot wire anemometer. Again, the accuracy is independent of the number of sensor positions above 16.
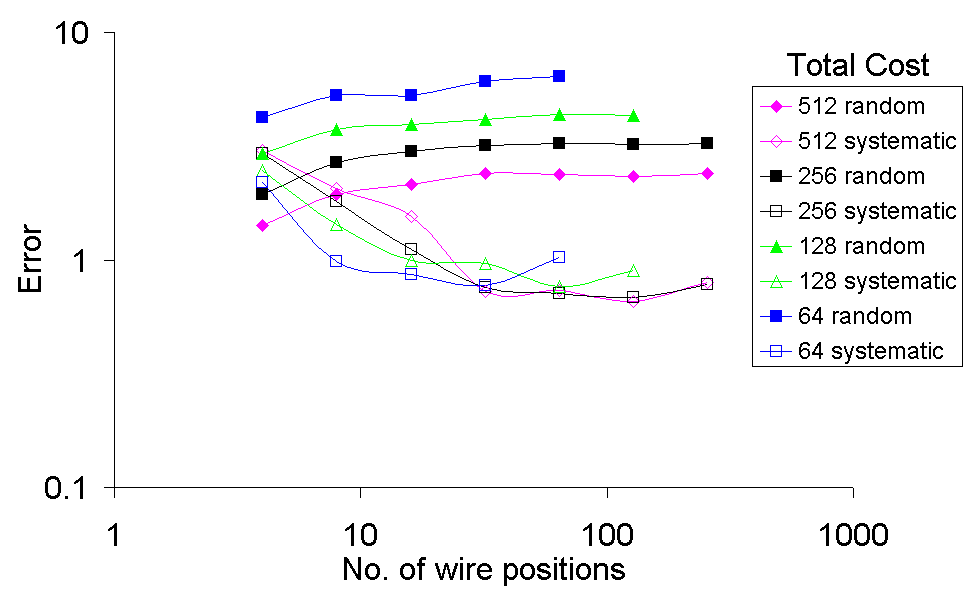
Figure 5 Effect of total cost and number of sensor positions
on the random and systematic errors in the measurement of flow angle
Figure 6 shows the systematic error for a given total cost of 512 in the case of the pressure probe. For most turbomachinery applications (turbulence greater than 10%) the systematic errors seem to be almost linearly dependent on the effects of turbulence. Below 10% turbulence the systematic error asymptotes to a small value of 0.1° , which is most likely due to truncation errors.
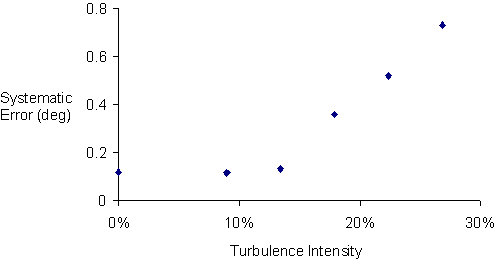
Figure 6 Effect of turbulence on the systematic errors
of flow angle for a total cost of 512 ensembles, pressure probe
A test for evaluation of the pressure probe and the application of the Least Squares method was conducted in a large scale radial inflow turbine. The measurements were performed at rotor exit.
In the case of the pressure probe the experiment was relatively ill suited. The range of the piezo-resistive transducer is +/- 35 000 Pascal. The measured dynamic head at exit to the rotor of the radial inflow turbine is between 10 and 150 Pascal. Nevertheless a successful first application of the probe is presented here.
Measurement errors arising from the effects of flow unsteadiness on the probe are not an issue in the present circumstances. At a rotational speed of 450 rpm, the blade passing frequency of the radial turbine is 7.5 Hz. The reduced frequency based on the probe diameter and a mean flow velocity at rotor exit was calculated to be 0.003. Hence, the probe will respond to the flow in a quasi-steady manner. Furthermore, measurement errors due to vortex shedding from the probe stem were also found negligible. In a flow where the RMS fluctuation were of the order of 2% of dynamic head, no vortex shedding could be detected in the frequency spectrum.
Figure 7 Radial variation of pitchwise average relative flow angle
Figure 7 shows the pitchwise averaged relative flow angle as measured by the two different probes. The data sets of both probes were processed using exactly the same procedure. The two data sets are in good agreement for both absolute angle and velocity.
See also the application of this method to Conventional Pressure Probes
Papers and a thesis by Roger Dambach and Howard Hodson are available in the download section. Press here to down load papers and PhD Theses.
Howard Hodson and Roger Dambach
Home | Current Research | Research Opportunities
Publications | Staff and Students
Research Facilities | Travel Information | Contact Information | Links