The calculations behind Fig. A are explained in Section 1 of the
(SOM) text.
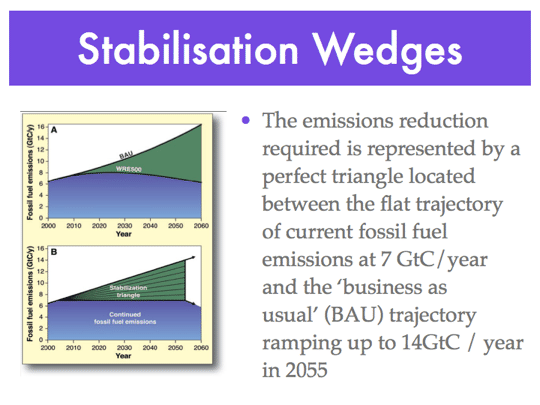
The Business As Usual (BAU) and stabilization emissions in Fig. A are near the center of the cloud of variation in the large published literature.
(A) The top curve is a representative ‘Business as Usual’ emissions path for global carbon emissions as CO2 from fossil fuel combustion and cement manufacture:
1.5% per year growth starting from 7.0 GtC/year in 2005. The bottom curve is a CO2 emissions path consistent with atmospheric CO2 stabilization at 500 ppm by 2125 akin to the Wigley, Richels, and Edmonds (WRE) family of stabilization curves described in T. M. L. Wigley in The Carbon Cycle1.
The area between the two curves represents the avoided carbon emissions required for stabilization at around 500ppm, which is a currently recognised goal.
(B) Idealization of (A): A stabilization triangle of avoided emissions (green) and allowed emissions (blue). The
allowed emissions are fixed at 7 GtC/year beginning in 2005. The stabilization triangle is divided into seven wedges, each of which reaches 1
GtC/year in 2055. With linear growth, the total avoided emissions per wedge is 25 GtC, and the total area of the stabilization triangle is 175 GtC.
The arrow at the bottom right of the stabilization triangle points downward to emphasize that fossil fuel emissions must decline substantially
below 7 GtC/year after 2055 to achieve stabilization at 500 ppm.