 On these charts, materials of each class (e.g. metals, polymers) form 'clusters' or 'bubbles' that are marked by the shaded regions.
We can see immediately that:
On these charts, materials of each class (e.g. metals, polymers) form 'clusters' or 'bubbles' that are marked by the shaded regions.
We can see immediately that:
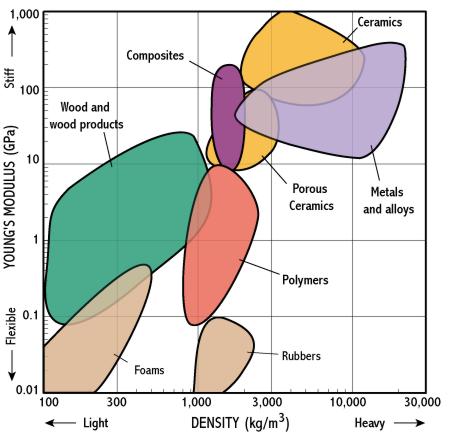
Here is a materials selection chart for 2 common properties: Young's
modulus (which describes how stiff a material is) and density.
On these charts, materials of each class (e.g. metals, polymers) form 'clusters' or 'bubbles' that are marked by the shaded regions.
We can see immediately that:
Where selection charts are really useful is in showing the trade-off between 2 properties, because the charts plot combinations of properties. For instance if we want a light and stiff material we need to choose materials near the top left corner of the chart - so composites look good.
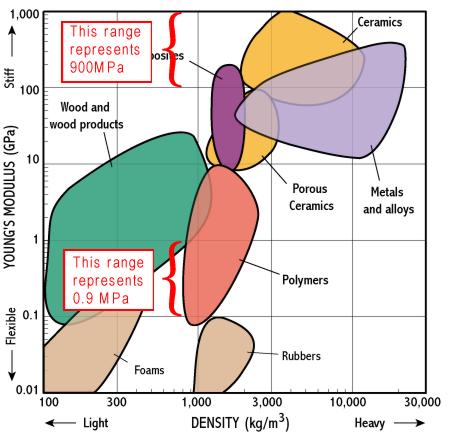
Note that the chart has logarithmic scales - each division is a multiple of 10; material properties often cover such huge ranges that log scales are essential.
There are a selection charts for many combinations of material properties, e.g. 'strength - toughness' and 'electrical resitivity - cost'. The next section shows how we cantake selection charts further.
|
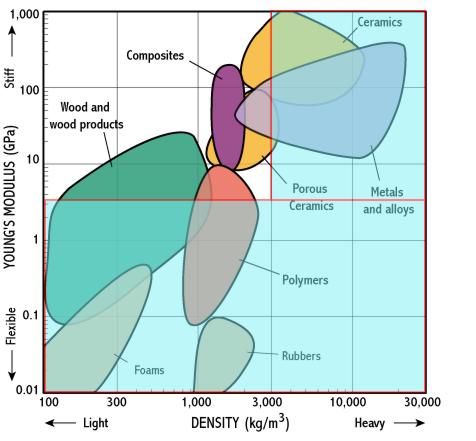
Consider a design problem where the specification is for a component that is both light and stiff (e.g. the frame of a racing bicycle). The Young's modulus - density chart helps us to find the best materials - they lie towards the top left. The charts can be annotated to help reveal the 'best' materials, by placing a suitable selection box to show only stiff and light materials. What can we conclude?
This still leaves quite a lot of choices, so what might be considered next to narrow the choice further? |
|
It is unlikely that only 2 material properties matter, so what other properties are important? Let's consider strength and cost - these properties are plotted on another selection chart. So, what else does this tell us about suitable materials classes? What can we conclude?
|
 |
|
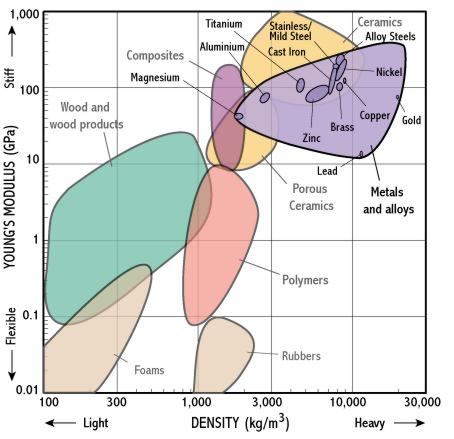
Selection charts can also be used to select between members of a given class by populating it with the main materials. For instance, we can do this for metals in the stiffness-density chart. What can we conclude?
Let's summarise what we've learnt about materials selection. |
|
 On these charts, materials of each class (e.g. metals, polymers) form 'clusters' or 'bubbles' that are marked by the shaded regions.
We can see immediately that:
On these charts, materials of each class (e.g. metals, polymers) form 'clusters' or 'bubbles' that are marked by the shaded regions.
We can see immediately that: